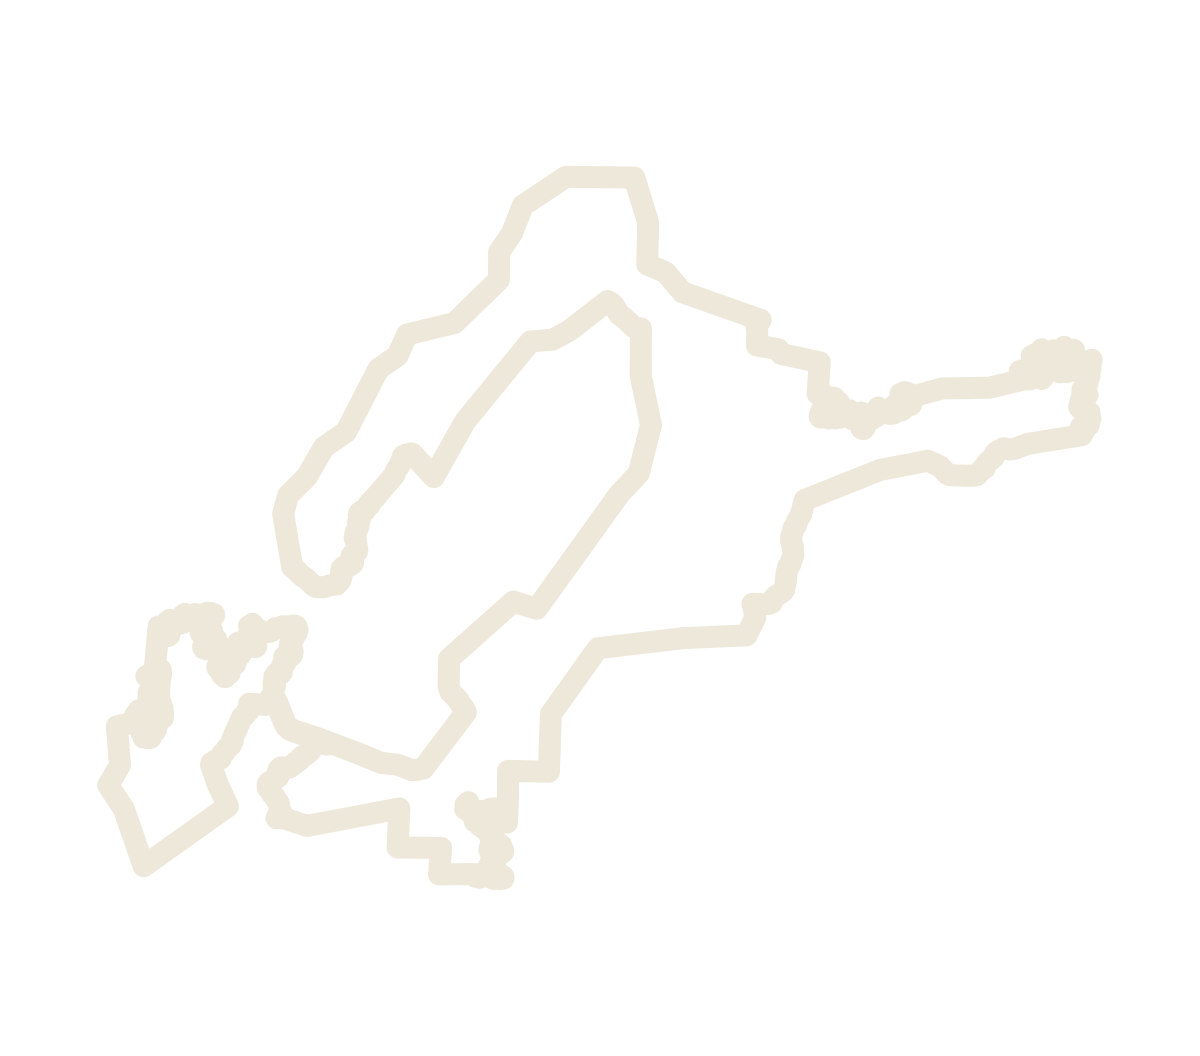
The district
The sand line is the proposed revision: the boundary description as proposed, drawn on the USGS historical survey maps it names, 104 steps and 105 points around 193.83 square miles.*
The map opens straight down, as a paper map reads. 3D tilts it; on a touch screen, two fingers drag up or down to tilt and turn to rotate. The other layers are off until you turn them on in the panel; each loads only then.
The data
NAD83 coordinates shown as WGS 84. The boundary data is dedicated to the public domain under CC0 1.0; the record is the boundary package for TTB, revision of October 15, 2026 .
Reading the 3D view
With the Hickory Aquifer or the wells turned on, the ground is see-through. Under it is the whole Hickory Aquifer as TWDB's groundwater model draws it: a ring around the Precambrian rock at the heart of the uplift, at the surface near that rock and deeper beneath younger rock away from it. Drag to turn the view; go below the ground to look up at it.
The layers are listed in the order they are drawn: from the sky, to the ground, to the rock beneath it. A layer higher in the list is drawn on top.
TWDB model layers, regional scale. Each block is a group of model cells , averaged from the model's cells, each … ft square. Vertical exaggeration 5× , applied to the ground and the aquifer alike.
When Esri's ground cannot be loaded, the ground is drawn flat and the aquifer and wells at their depths below the model's own ground; when Esri's basemap cannot be loaded, the layers are drawn on a plain background. The line at the foot of the view says so.
Wells
Wells: … TWDB reports across the area of TWDB's model, which takes in the whole granite core, where most wells find no Hickory Aquifer (… driller's reports, … more from the Groundwater Database; … Groundwater Database wells match a driller's report and are drawn once; … with no depth are drawn as a head only). Each line runs from the ground to the depth the report gives, at the same exaggeration as the aquifer, so you can see whether a well reaches the Hickory Aquifer or stops above it or beside it. … have a log, colored interval by interval: an interval takes the first of granite, gneiss/schist/marble, sandstone (or "Hickory"), limestone found in its description, else "other". The rock classes are keyword matches on the drillers' own words: "other" takes in sand, clay, shale, gravel, caliche and the rest.
Only the wells that pass the filters are drawn. The lines zoomed out are those of one well in each … ° cell (… wells), where it passes. Zoomed far out, the head of every well that passes is drawn while no more than a few thousand pass; when more pass, only those one-per-cell wells, head and line. From about the district's scale in (… ), the head of every well that passes, still with only those lines; from about … in, every line as well, in … ° tiles around the middle of the view, and the note under "Show wells" says how many wells that pass, in view, have only their heads drawn. Click a well for its report, every field that holds something, without people's names or addresses. Click a vineyard block for the wells within … m of it, nearest first.
A well is a head at the ground colored by the rock the water comes from, and a line to the reported depth colored down the hole by the well's own log. Head color: the rock of the logged interval that holds the well's water-bearing zone; if none is logged, its deepest logged interval; gray if unlogged. Line color: each interval takes the first of granite, gneiss/schist/marble, sandstone (or "Hickory"), limestone named in its description, else "other". The legend's colors: sandstone, or "Hickory" in the log; granite; gneiss, schist or marble ("Metamorphic"); limestone; other rock; not logged.
White ring: TWDB's Groundwater Database assigns this well to the Hickory Aquifer. "Hickory Aquifer only" shows just those wells (… ). "Water levels" adds the water-bearing intervals (thick) and static water levels (small dots) to the lines drawn; it starts off.
Well use is the report's own use (WellUse in the Groundwater Database, ProposedUse on a driller's report), grouped: Irrigation; Domestic; Livestock / stock; Public supply; Industrial / commercial / mining; Recreation; Monitoring / test / other / unknown. Water volume is the highest tested yield the report gives, in gallons per minute (… wells give one); test methods vary. Depth is the reported depth, in feet. "Include wells with no value" keeps the wells whose report gives no yield or no depth. The count is of every well in the data that passes the filters, not only those in view. Shown at first: irrigation wells that tested at 25 gpm or more; widen the filters to see the rest. Reset goes back to them.
The model and TWDB's outline
TWDB's 2017 outline lines up with the USGS geologic map as published, not with the outcrops on the imagery, so it carries the same misregistration. Here it is shifted by the same amount as the geology: … m west and … m north. The model's cells are left where TWDB put them; their outcrop was drawn from the surface geology too, so it probably carries the same offset, about one cell.
TWDB's official outline and its model differ. The shifted outline covers … sq mi; the model has the Hickory Aquifer in … sq mi of it (none in the other … ) and in another … sq mi outside it, drawn pale: mostly the band the model runs beyond the outline's downdip edge, and … sq mi within … miles of the Precambrian rock at the surface.
The darker diagonal bands are faults. The model's top steps down across them: … of the cells beside a step of more than … ft lie within … ft of a fault line in the model's source data. At … of those steps the fault has moved the layer by more than its thickness, so the two sides no longer touch: you see the aquifer's side and a gap, which the model fills with the rock above and below the Hickory Aquifer, not missing data.
Your location
Your position is never sent to this site or anyone else, and it is not stored. Flying the view there loads Esri’s basemap and elevation tiles for that area, as any web map does, so Esri’s servers see which area is shown.
My location: the browser's own location service. The position is used only on this page: to place the point, to look up the model cell in a file the page downloads whole (no request names the position), and to move the view, which loads Esri's tiles for that area. The answer is an estimate from TWDB's regional model, whose cells are … ft square, not a site survey.
Sources and limits
Aquifer: Texas Water Development Board, Llano Uplift Aquifer System Groundwater Availability Model v1.01 (Shi and others, 2016), top and bottom of model layer 7, from its GAM Properties archive (file of … ). A cell is used where it is active and its center lies inside TWDB's 2017 official Hickory Aquifer outline, outcrop and subsurface (Minor Aquifers shapefile , December 2017), shifted by … longitude and … latitude (about … m west, … m north), the shift the repository applies to the USGS geologic map (resources/geology). Cells are grouped into blocks of … × … (large screens) or … × … (phones); a block is drawn where at least half its cells are used, at their mean top and bottom. Grouping smooths fault steps inside a block and moves edges by up to half a block. Fault lines: the model's source geodatabase (lnup_source_data.gdb), layers Modified_GAT_Faults and Pennsylvanian_Faults.
Limits: the model's surfaces were mainly drawn by hand, no active cell is thinner than … ft, and TWDB says the data are for regional-scale use only, not for individual sites. The outline's outer, downdip edge follows a limit of water quality, on dissolved solids (per TWDB's structure contractor), not the end of the sandstone. Block tops on the outcrop are the model's ground, so they sit a little above or below Esri's ground.
Hickory Sandstone Member of the Riley Formation: USGS State Geologic Map Compilation (Horton and others, 2017; Texas unit TXCAh), shifted about … m onto the outcrops (the copy in the repository's resources/geology), because SGMC as published sits south-east of them. It is the statewide map at 1:500,000, and the shifted copy covers the Llano Uplift area only. The Bureau of Economic Geology's 1:24,000 geologic quadrangle maps would replace it; most of them are published as PDF only (Fly Gap's alone is GIS), and no Bureau of Economic Geology data is used here. Precambrian rock: model layer 8 outcrop cells (ibound 81). Llano Uplift AVA: TTB's AVAs_Production layer, status "Proposed", queried … . County lines: U.S. Census Bureau 2023 cartographic boundaries , 1:500,000. Towns: Census 2023 Gazetteer internal points. Ground: Esri World Elevation. Basemap: Esri. District: the petitioners' proposed revision of the boundary in TTB's Notice No. 243, as described under The district above.
Wells: Texas Water Development Board, Submitted Driller's Reports database (SDRDownload.zip : well data, lithology, bore hole, casing, water strata, water levels, well tests, plugging reports) and Groundwater Database (GWDBDownload.zip : well main, lithology, bore hole, casing, well tests, water levels), files dated … , fetched … . Every report whose position lies in a cell of TWDB's Llano Uplift model where any layer is active: the Hickory Aquifer's outline and a margin around it, which takes in the whole Precambrian core. Driller's report positions marked NAD27 were moved to NAD83 with the NADCON 5.0 grid; the rest are used as published (most give no datum). TWDB says its well locations are not verified by its staff and may be inaccurate. Removed before the data were written: owners', drillers', apprentices', pluggers' and companies' names, license numbers, street and mailing addresses, the location description, and owner and district well numbers. Comments, remarks and other notes are blank where they hold any of those names or their initials, a title, a person's role ("owner", "drilled by"), a company's name, a phone number, an address, a groundwater district's well number, initials on a number, a word that is too rare to be a well term or, in the notes about people, a word of any name in the area or initials. In a line of a well's log, only those words are taken out, marked [removed], so its rock stays. A check stops the build if any name survives. "Hickory Aquifer only" in the filter is TWDB's aquifer assignment in the Groundwater Database.
Vineyards, in four layers: the Hickory Sands District's (… blocks of … vineyards, inside the proposed district) and the Llano Uplift's (… blocks of … vineyards, outside the district and inside TTB's proposed Llano Uplift AVA), each block outlined by eye on NAIP 2022; vineyards under development (… : Hartgrove Hill, by its 2022 outline, and Paisano Vineyards' two planned blocks, approximate, traced from its preliminary planting plan: it is being planted, with site preparation under way for about 6 acres to be planted in 2027 and 2028); and historical vineyards (… ), shown by their 2022 outlines. The names come from the petition's Exhibit 3, the petitioners' vineyard layer (2022), the Llano Uplift petition's Table 1 (TTB-2026-0005-0006), Texas Wine Lover guide listings and the petitioner; Heart of Art Vineyard is the block outlined in the petitioners' response to Comment 8 (Comment 9, TTB-2026-0005-0019) on USGS NAIP Plus imagery, about ±15 m. A block's popup gives its source. Only the named vineyards were looked at, so this is not a survey: other vineyards may exist. Acres are of the outline, not of the planted vines.