The Hickory Sandstone Member of the Riley Formation. At 1,500 feet and higher.
At the surface. Sandy ground near Mason.
The place
Sand, height and water.
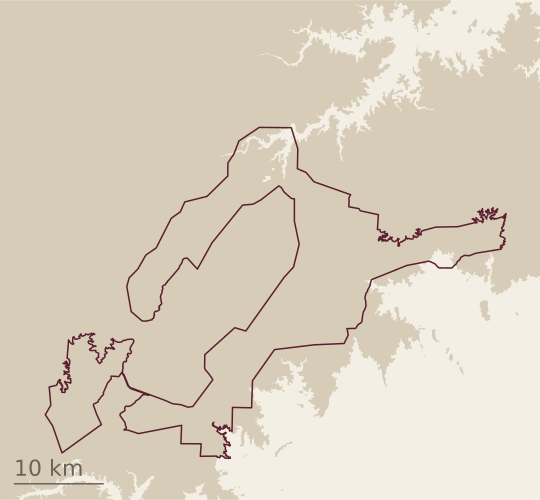
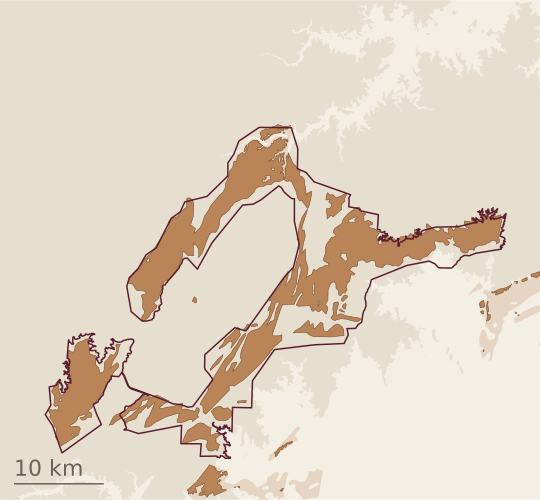
Notice No. 243 describes the line as drawn “to encompass the portions of the Hickory Sandstone Member geologic formation that are at 1,500 feet or higher.”1 The petition names the key elements that ground imparts: “the Hickory aquifer, Hickory Sands soils, and elevation at 1,500 feet or higher.”2
01 · Elevation
Ground at 1,500 feet and higher
From USGS elevation data.3 The petition uses elevation as a factor in drawing the boundary.2
02 · Sand
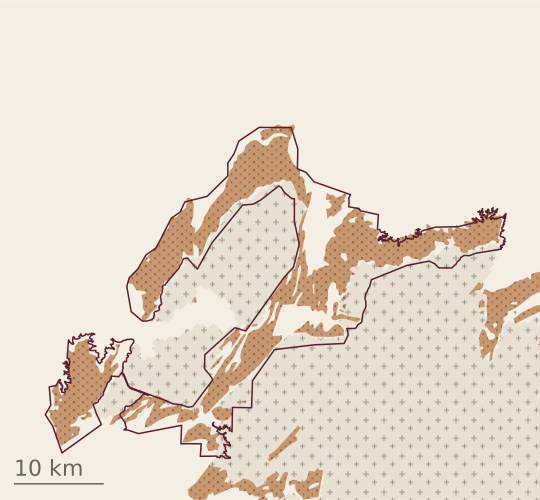
Hickory Sandstone MemberPrecambrian rock (TWDB model)Other rock, or not shown at this scale
The sandstone at the surface,4 in a ring around the uplift’s core of granite, gneiss and schist.2, 5 Weathered, it gives the sandy, loamy soils the petition calls “Hickory Sands soils.”1, 2
03 · Water
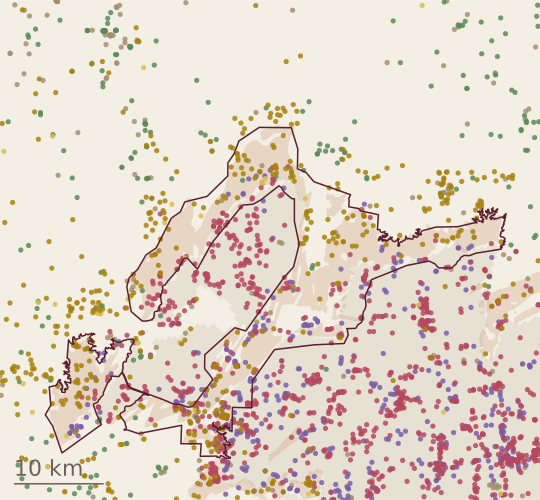
SandstoneSandGraniteGneiss, schist or other metamorphic rockLimestone or dolomiteOther
The Hickory Aquifer is the water-bearing part of the Hickory Sandstone Member.2, 62,594 logged wells from TWDB’s records, each colored by the first rock its driller names at its deepest water-bearing zone, or else at the bottom of its log.7 Sandstone and sand are drawn on top.
04 · Together
The sandstone at 1,500 feet and higher
The line follows roads, creeks and other features printed on the USGS maps around it, as the rules require, so it takes in some ground around the sandstone’s edges.1, 2
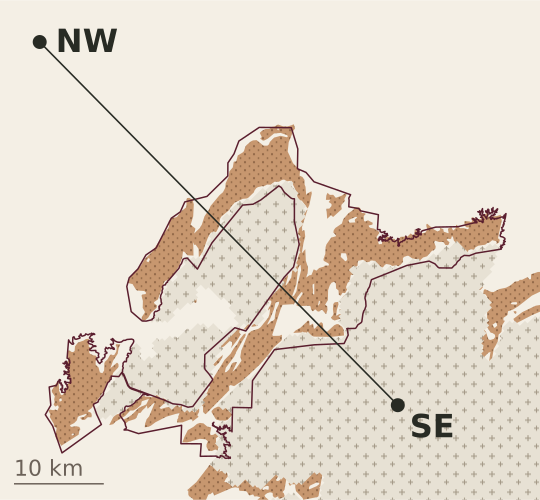
The proposed revision, . The geologic map is USGS’s regional compilation,4 moved about 400 meters by this site to sit on the outcrops seen in aerial imagery (how). The core is the Precambrian outcrop of TWDB’s groundwater model, in quarter-mile cells.8
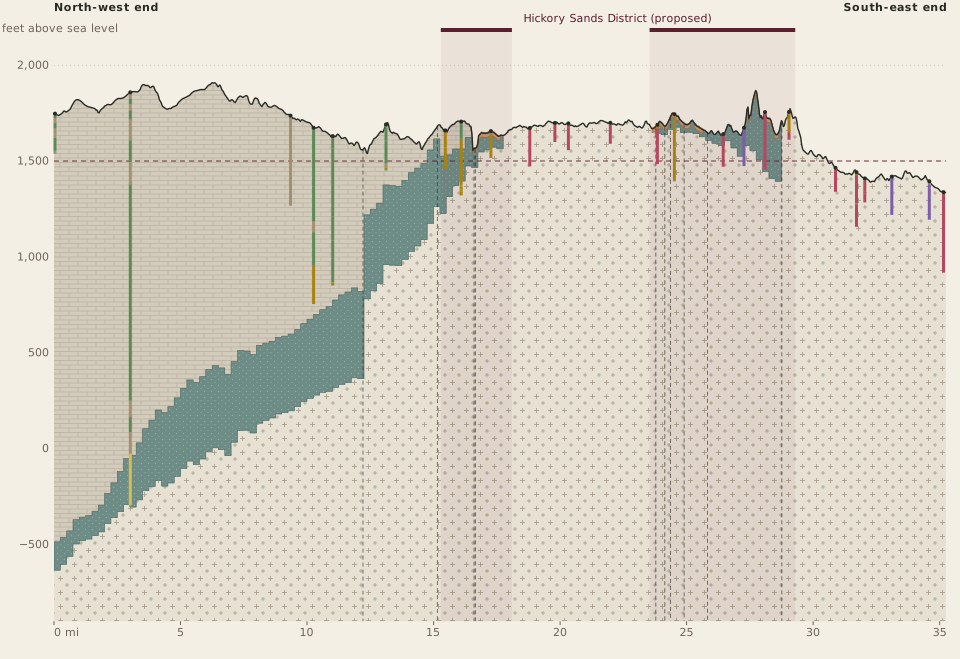
The slice follows part of TWDB’s section line A–A′, model row 239: 35.25 miles from north-west to south-east, crossing the district in 2 places.8 The ground is drawn from USGS elevation data, the rock from TWDB’s groundwater model of the Llano Uplift, and the wells from the State’s driller’s reports.3, 7, 8
Vertical scale 40 times the horizontal.
01
The ground
The ground along the slice, from USGS elevation data.3 The dashed line marks 1,500 feet. Where the slice runs, from its north-west end (NW) to its south-east end (SE):
Hickory Sandstone Member
Precambrian rock (TWDB model)
The district
02
The sandstone
The Hickory Sandstone Member of the Riley Formation: at the surface on the USGS geologic map,4 and below ground as the Hickory layer of TWDB’s model.8 It lies on much older granite, gneiss and schist, in a ring around the uplift’s core.2, 5
Hickory Sandstone Member
At the surface, on the geologic map
03
The aquifer
Its water-bearing part is the Hickory Aquifer;2, 6 the water fills the spaces between the sand grains.2, 9 Rain falling on the outcrop recharges it.5, 9 Where the sandstone is at the surface, much of its water lies under a water table within it, with unsaturated sandstone above; where it dips away under younger rock its water is confined, under pressure, and rises in a well above the level where it is first met.5, 6, 9 The slice colors the whole sandstone, as TWDB’s model treats it,8 and draws no water table or pressure level. At the slice’s north-west end, the top of the sandstone lies about 2,240 feet below the ground in TWDB’s model.8
An illustration, not to scale, after Mason’s account.9 The slice above draws neither line: it has no measured water table or pressure level to follow.
The sandstone, which TWDB’s model treats as the aquifer throughout
04
The core
Where the old granite, gneiss and schist are at the surface, the sandstone is absent.5, 10, 11 Two things made it so. It was laid down around old granite knobs, on a surface whose relief controlled where it was deposited, and it thins to “zero thickness at the Precambrian granite knobs.”5, 10 Its thinning toward the center of the uplift as a whole is probably due to later erosion rather than to how it was first laid down.5 Above the sandstone, away from the core, lies younger rock.8 The dashed lines are faults from TWDB’s model data, along which the rock layers were moved up and down.5, 8
Precambrian granite, gneiss and schist
Younger rock
Fault
05
The wells
Real wells within 800 meters of the line: the deepest logged well in each mile that has one, 25 in the slice’s 36 one-mile stretches, the last a quarter-mile. Each is shown at the point of the line nearest to where its report puts it, drawn to its reported depth, and colored interval by interval by the first rock its driller names.7 Where the sandstone is at the surface, the logs record it, some with granite or other old rock at the bottom of the hole beneath it. Where the old rock is at the surface, most logs reach granite or metamorphic rock beneath a thin cover.7, 11 To the north-west, wells pass through younger rock, much of it logged as limestone; one log there names the Hickory at its bottom.7
Sandstone
Sand
Granite
Gneiss, schist or other metamorphic rock
Limestone or dolomite
Other
06
The district
The stretches where the line runs inside the proposed revision of the district. The boundary
Hickory Sands District, proposed revision
Three questions
Why is my sand not the Hickory Sands District?
Sandy ground is not enough on its own: Notice No. 243 notes “hickory sands” soils in the proposed Llano Uplift AVA as well.1, 11 TTB proposes that only the full name be protected, so that wine labels can still truthfully mention “hickory sand” soils.1 The district is drawn around the sandstone at 1,500 feet and higher;1 what the petition relies on is soil depth over the sandstone, together with its groundwater.2, 11
Why does my well find granite?
The Hickory Sandstone Member lies on much older granite, gneiss and schist.2, 5 A well through the sandstone can reach that rock at the bottom of the hole.7 Where the old rock is at the surface, the sandstone is absent,5, 10 and most wells reach granite or other old rock beneath a thin cover.7
Where is the aquifer deep, and where at the surface?
At the surface where the sandstone crops out, in and around the district; rain falling there recharges it.5, 9 Away from the core it dips under younger rock:5 at the slice’s north-west end its top is about 2,240 feet down in TWDB’s model.8 Under the core itself it is absent.5, 10
TWDB’s model is regional: quarter-mile cells (1,320 feet), surfaces drawn largely by hand, “for regional scale use only.”5, 8 It treats the whole Hickory layer as the aquifer;8 in much of the outcrop the water lies under a water table within it.9 In places its quarter-mile cells carry the sandstone across ground where the geologic map and the drillers’ logs find old rock at the surface.4, 7, 8 The vertical scale is exaggerated 40 times. Wells are shown at the point of the line nearest to where their reports put them, up to 800 meters away, and drawn from the slice’s ground line.7
Deep time
How the sand came to be.
Eight stages, from the oldest rock to the ground today. The small numbers lead to the sources.
01
More than a billion years ago
Approximate: ranges from published summaries of zircon dating, not dates for single rocks.
The basement
Sediments and volcanic rock gathered along the southern edge of ancestral North America and in a volcanic arc offshore, from about 1,370 million years ago.12, 13 A collision of continents, about 1,150 to 1,120 million years ago, buried them deep and folded them into the Valley Spring Gneiss and the Packsaddle Schist; the folds show in road cuts on US 87 south of Mason.14, 15, 16 Granites rose into them as the collision ended, the Town Mountain Granite among them, about 1,120 to 1,070 million years ago.12, 13
02
About 1,070 million to roughly half a billion years ago
The gap is certain; its length varies: more than 500 million years where the sand rests on granite, more where it rests on the older gneiss. The dates mark the gap in the rock, not a measured span of erosion.
The missing time
By the Cambrian the old rock was a rolling surface of granite knobs and hollows, with up to about 800 feet of relief by one estimate, and the granite had crumbled in place to grus.5, 16, 17 Where sand later buried that surface, rock more than a billion years old lies directly under rock about half a billion years old: the Great Unconformity.16, 18 This stage shows that surface as it stood just before the sand came, not every landscape before it.
The unconformity marks missing time, not a measured span of erosion: the rock that might have recorded those hundreds of millions of years is not here.16 Dating of zircons from the uplift’s rock, as one review summarizes it, records more than 6 kilometers of rock worn off above it between about 800 and 750 million years ago, likely as the flank of a rift was raised while the supercontinent Rodinia broke apart.12 How the wider unconformity formed is still argued: one prominent idea is glacial erosion in the Snowball Earth episode; others see many smaller unconformities from Rodinia’s assembly and breakup.12
03
Roughly half a billion years ago
Dated by its fossils, not by radioactive decay, so the age is approximate; the lowest beds hold no fossils and may be somewhat older in places.
The Cambrian sea
A shallow sea spread across North America and drowned the hills.5, 12 This was a marine transgression: the shoreline moved inland across the land as the sea spread.16, 18 On its beaches and tidal flats, in its estuaries and tidal channels, sand that rivers, fans and wind had spread over the old surface was worked and reworked into the Hickory Sandstone Member of the Riley Formation: thick in the hollows, thin or absent over the knobs.5, 16, 17, 18, 19 Trilobites in it, some collected at Streeter in western Mason County, date it.20, 21, 22, 23
Near the old granite hills, its lowest beds hold pebbles and cobbles of the local granite; at one road cut on Farm Road 2323, cross-bedded sand reworked from the granite’s grus lies directly on the weathered granite.4, 16 Rivers and wind also brought sand from far inland to the coast, where it too was reworked.18 Of more than 1,700 zircon grains dated from the Hickory Sandstone Member around the uplift, those from its western side, where the district lies, came mostly from older basement far to the north and north-west (as directions run on today’s map), itself largely granite and rhyolite; those from the eastern side came mostly from the Llano’s own rock.18 Zircon is a tracer: the counts are of grains, not shares of the sand.
04
About 500 to 470 million years ago
The order of the layers is certain. The numbers are approximate: fossil zones matched to the international time scale.23
Under later seas
The sea deepened. Limestone and more sand, the Cap Mountain Limestone and Lion Mountain Sandstone members, completed the Riley Formation. The Wilberns Formation followed, laid down on a shallow shelf; its microbial mounds still show on the Llano River at White’s Crossing, south of Mason. Then came the limestone and dolomite of the Ellenburger Group.5, 16, 20, 24 In this first burial, which lasted until the end of the Early Ordovician, more new minerals grew between the sand grains, calcite among them.19
05
Roughly 323 to 307 million years ago
The sources say early to middle Pennsylvanian; the numbers are that span on the international time scale, not a measured date.23
The dome
After the Ellenburger Group was laid down, the area was raised and worn down more than once, and later seas left limestone and shale, much of it since worn away; the drawing leaves these layers out.5 When the southern continents collided with North America and raised the Ouachita mountain belt, the Llano area was pushed up into a dome and broken along north-east-trending faults, with throws of up to about 3,000 feet, that dropped younger rock against older.5, 16, 19 The Hickory Sandstone Member was tilted and faulted with the rest.5, 19 Its deepest burial is thought to have come about this time, possibly in the middle Pennsylvanian. Where it lay deeper than 3 kilometers, quartz cement filled most of the pores between its grains; where it was never buried more than 1 kilometer, it has stayed porous and permeable.19
06
About 299 to 100 million years ago
Not dated closely: the long wearing-down from the Permian to the Jurassic, and when the sea first reached the area and finally covered the uplift, both in the Early Cretaceous.23
The Cretaceous sea
Through the Permian, Triassic and Jurassic the region was raised and worn down to a low, rolling surface cut across the tilted and faulted layers, probably bringing the Hickory Sandstone Member near the surface again.5, 19, 25 Then a sea returned from the south-east. The Llano high stood for a time as a promontory, then was largely buried under the sea’s sand and limestone; at Bear Mountain, near Fredericksburg, Cretaceous rock rests directly on granite.5, 16, 25 So the Cretaceous rests on whichever older rock that surface had reached: Paleozoic layers in some places, and in others the Precambrian rock itself, where the layers above had been worn away or never laid down. The contact is a second unconformity, at the base of the Cretaceous, far younger than the Great Unconformity.5, 16, 25
07
Within the last 66 million years
Not dated closely. Published work places a later uplift of the region in the Neogene, about 23 to 2.6 million years ago, and the Balcones faults south-east of the uplift mostly in the late Oligocene and early Miocene; we found no study that dates when the cover came off any one place, the district among them, so the stage is shown as one long interval.19, 23, 25, 26
Uncovered
In the Neogene the region rose again, as part of the wider uplift of the Cordillera.26 South-east of the uplift the Balcones faults broke the Cretaceous rock, and new streams cut back from them toward the plateau; the streams are still cutting down into the uplifted rock.25 The rise, the stripping of each layer of cover and the cutting of the valleys need not have happened at the same time.
Erosion stripped the Cretaceous cover from the center of the old dome and cut down into it, as a knife takes the top off an onion: the oldest rock, granite and gneiss, at the core; the Hickory Sandstone Member in a ring around it, dipping away in every direction; younger rock beyond.5, 17, 19 Over the core the sandstone is gone, down to the old rock beneath; TWDB’s modelers judge that the sandstone’s thinning toward the uplift’s center probably owes more to erosion than to how the sand was first laid down.5 The old rock wears down faster than the rim of younger, harder rock around it.5 The Llano Uplift today is both: a basin with a rolling floor, and rounded hills of Precambrian granite rising 400 to 600 feet within it, such as the Enchanted Rock granite dome.5
As the region rose in the Neogene, water from rain soaked into the sandstone, dissolving feldspar, about 5 percent by one estimate, and an unknown amount of calcite. Some beds, once rich in feldspar, had lost most or all of it over their long history and are now nearly pure quartz sandstone. Cement closed pores; dissolution opened new ones. Where the sandstone was never deeply buried, its original pores and the secondary pores opened by dissolution together make an excellent aquifer.19
08
Today
The soils are not dated.
Sand and water
Weathering is turning the Hickory Sandstone Member back into loose sand. Rain falling on the outcrop recharges the Hickory Aquifer. Where the sandstone dips away under younger rock its water is confined, under pressure; the aquifer supplies Brady, Mason and Fredericksburg.5, 6, 9 The sandstone’s age is not its water’s: carbon-14 and tritium find younger water near the outcrop in Gillespie, Mason and McCulloch counties, where rain recharges it, and older water downdip in McCulloch County.5
Water under the ground
Three wells, three rocks.
In and around the proposed Hickory Sands District, wells a few miles apart differ widely in depth, water level and yield, by the rock they are drilled in.7 Here are three typical wells, grouped by mapped geology and inferred aquifer: one on the Hickory Sandstone Member of the Riley Formation, one on Precambrian granite, and one far downdip, where the member lies deep under younger rock.9, 27, 4
Outcrop well
Granite well
Example: TWDB driller’s report 524179 (Llano County, 2019). Its own depth scale, down to 145 ft; not the group’s medians.
Illustrative: a screened well in granite gravel and weathered granite over granite. Depths and values are illustrative; flow paths are schematic.
Deep downdip well
The three places
Schematic, not to one scale: each drawing has its own depth scale, the downdip one is broken, and the granite example is one documented well. Step 05 shows the groups’ depths to scale.
01 / 06
01
The three places
On the outcrop, the Hickory Sandstone Member is at the surface.4 On the granite, Precambrian granite is at the surface, Town Mountain Granite and the younger granitic intrusions; the member has “zero thickness at the Precambrian granite knobs.”10, 4
Away from the uplift the member dips under younger rock, away from the uplift in all directions; in McCulloch County “northward and northwestward at about 120 feet per mile.”9, 27 The downdip well drawn here stands for wells where TWDB’s model puts the member’s top 1,500 to 3,000 feet down.8, 7
Outside the member’s surface outcrop, wells may still reach the Hickory Sandstone Member where it continues underground beneath younger rocks.27, 28 This differs from areas where Precambrian granite or gneiss is at the surface: that older basement lies beneath the member in the normal geological sequence.10, 11 The granite examples shown here do not demonstrate a connection to the Hickory Aquifer.
The drawings are schematic and not to one scale: each has its own depth scale, the downdip one leaves out part of its depth, and the granite drawing is one documented well, drawn to 145 feet. Step 05 draws the groups’ depths to one scale. Moving water shows how water reaches each well; faint dashed arrows are conceptual pathways, not documented routes.
Hickory Sandstone Member
Precambrian rock
Younger rock
Casing
Screen or perforated casing
Open hole
02
Where the water is, and how it reaches the well
Outcrop. The water is held “in the spaces between the sand grains.” “Water occurs under water-table (unconfined) conditions in much of the outcrop area … and under artesian (confined) conditions in the rest of the county.” The lower part of the member is coarser and more productive, and “is tapped by most of the larger capacity wells in the county.”9 Water moves through the connected pore spaces of the saturated sandstone into the well’s producing interval, a screen or open hole; the drawing’s completion is schematic.
Granite. Water “occurs in fractures and in the weathered zone in the outcrop area,” yielding “small quantities … to domestic and stock wells.”9 USGS puts it plainly: “Spaces in crystalline rocks are microscopically small, few, and generally unconnected,” and “movement of water through the rocks is totally dependent on the presence of secondary openings”; these rocks “are permeable only where they are fractured.”29 Two kinds of granite aquifer are described in Burnet County. Weathered granite gravel, the “Granite Gravel Aquifer,” is “composed of weathered or decomposed Town Mountain Granite,” saturated from a few feet to about 100 feet, with estimated yields “from as little as 5 gpm up to 100+ gpm.”30 Fractured solid granite is “generally suitable only for domestic use because well yields are typically low (less than 25 gpm) and many cannot sustain continuous pumping.”30 These describe Burnet County, where yields vary widely; they are not measured yields for wells elsewhere. In TWDB’s model the granite stores far less: storativity 0.001, against 0.09–0.3 on the member’s outcrop.8
The example granite well. The main granite drawing is one documented well, TWDB driller’s report 524179 (Llano County, 2019), drawn to its own depth scale; it is not the granite group’s median. The report records topsoil to 1 foot, red granite gravel to 21 feet and gray granite to 145 feet; blank PVC casing to 21 feet, with open hole below; water at 124–127 feet; a static level of 31 feet, measured by steel tape on ; and a jetted test of 12.24 gpm.31 The well receives water through connected openings within granite. The report does not establish where the connected fracture network is recharged. It identifies the rock and the water-bearing depth; it does not map fractures, so the fractures are drawn schematically, as inferred flow through fractures, with intact granite between them.29, 31 Blank casing across the shallow gravel prevents direct entry through the casing, but does not prove the surrounding fracture network is disconnected from weathered material elsewhere.
Screened wells in gravel and granite. Where granite gravel and weathered granite lie over the granite, a well may instead be screened through the loose material and into the rock below: in loose material “a screen is ‘telescoped’ inside the casing.”32 The other granite view draws such a well, with rounded illustrative depths and values. Water can enter through connected spaces in the gravel and weathered material, and through water-bearing fractures intersecting the screen.33, 29 The sources do not establish each pathway’s contribution, so the flow paths are schematic.
In solid rock, “the normal practice is to ‘seat’ the casing firmly in the top of the rock and drill an open hole to the depth required to obtain the needed yield.”32 The example granite well is built that way; the outcrop and downdip completions are schematic.
Downdip. Under younger rock the member’s water is confined, under artesian pressure.9 Water moves through the confined sandstone into the well’s producing interval, perforated casing or a screen in the drawing (schematic), and rises inside the well (step 04).
Water in the rock
Water moving into the well
Documented water-bearing depth (granite example)
03
Where it comes from
Outcrop. Recharge is “chiefly from precipitation on the outcrop.”9 “Most recharge to the Hickory … is from rainfall on the sandy outcrop, but a significant amount occurs where rivers and tributaries cross the outcrops.”27 The drawing’s rain arrows are conceptual: they show that rain on the outcrop recharges the sandstone, not the route to any one well.
Granite. Recharge and flow are predominantly local: rain soaks into the weathered layer, and the aquifer has “low storage and shallow localized flow systems.”34 TWDB’s model puts average recharge on the Precambrian outcrop at 0.18 inches a year, against 1.09 on the member’s outcrop.8 For the example well the recharge route is not documented, so its recharge arrows are conceptual.31
Downdip. The water enters on the outcrop and moves slowly downdip, as “underflow.”9 The faint dashed arrow shows a possible long-term groundwater pathway (conceptual); it does not mean recent rain quickly replenishes deep wells. Carbon-14 and tritium find younger and mixed water near the recharge zone and slightly downdip in Gillespie, Mason and McCulloch counties, and older groundwater downdip in McCulloch County: “The downdip wells in McCulloch County have very low radiocarbon activities …, suggesting long groundwater residence time.”5
Conceptual pathway, not documented
04
Water levels
Each well shows its static water level, where the water stands at rest. In an outcrop well the median static level is 61 feet, 68 in irrigation wells; in the granite group, 30 feet.7 The outcrop well’s pumping level is drawn with an assumed drawdown of 20 to 60 feet: only 3 outcrop tests record one.7 The granite example’s static level is 31 feet; no pumping level was measured, so none is drawn.31 In the screened gravel-and-granite drawing the static level, about 30 feet, is illustrative, and no pumping level is drawn. Its jetted test of about 20 gpm is illustrative too: not a measured yield for any location, and neither it nor any single test establishes a Hickory Aquifer completion or sustained irrigation capacity.
Downdip, the aquifer and the water level are far apart. The member’s top is about 2,150 feet down at the median in TWDB’s model; the water rises inside the well to a static level of about 306 feet (the median of the latest TWDB measurements, 34 wells) to about 416 feet (the median at completion on drillers’ reports, 34 wells).8, 7 Confined water “will rise in wells above the level at which it is first encountered”: it is the water in the well that rises, not the aquifer.9 Pumping draws it down about 50 feet more: the median drawdown on 25 recorded tests, some estimated or jetted.7 Levels are “more than 400 feet below the land surface in some Hickory … wells far downdip.”27
A pump lifts water from the level while pumping: “Lift is the distance from the well’s water level while pumping to the centerline of the outlet pipe.”35
Static level
Pumping level
05
Side by side
Typical wells in Gillespie, Kimble, Llano, Mason, McCulloch, Menard and San Saba counties, grouped by mapped geology and inferred aquifer: the mapped rock at each well and, downdip, the depth to the member in TWDB’s model.8, 7, 4 That does not establish each well’s producing formation, and completion records were not used to confirm each assignment. Where drillers logged the water-bearing stratum, 179 of 236 logs in the outcrop group (76%) name sandstone and 37 (16%) granite; 326 of 377 in the granite group (86%) name granite.7
Median well depth, to scale.
Wells grouped by mapped geology and inferred aquifer; completion records were not used to confirm each assignment. The granite drawing is one documented example (TWDB driller’s report 524179: 145 ft deep, static level 31 ft, 12.24 gpm jetted); this table gives the granite group’s medians.
6 gpm; none of 1,450 wells with a test at 200 gpm or more7
400 gpm (33 wells with a test: mainly stock and public supply wells; 3 irrigation)7
Lift energy (lift only), kWh per acre-foot
about 130–190 (median static level 61 ft + an assumed 20–60 ft drawdown)35, 7
often insufficient for sustained vineyard irrigation; suitability depends on the individual well’s tested capacity and irrigation demand30, 7
about 550–720 (static level 306–416 ft + the 50 ft median drawdown)35, 7
Cost to build and equip one well, by construction class, at the stated depths and capacities planning-level estimates, July 2026 dollars; bids vary about ±35%
about $8,000–$29,000 per hole drilled (the same class at a similar depth; these sources price small wells by depth, not by rock)39, 38, 40; with about 30% of boreholes dry, the expected cost per working well is higher34
not this class
Lift energy: 1.373 water-horsepower-hours per acre-foot per foot of head, which is 1.024 kWh at 100% efficiency, or 1.55 kWh at the Nebraska Pumping Plant Performance Criteria; the source multiplies by total dynamic head, and this strip uses lift only.35 At the middle of the assumed outcrop drawdown (40 ft), the downdip well takes about 3.5 to 4.6 times the lift energy of an outcrop well, and about 3 to 6 times across the whole assumed range; not the 15 times its depth would suggest.
At the same construction class and capacity, the deep well costs about 4–5 times as much: at city grade, 4.8 times at 150 gpm and 3.8 times at 400 gpm. At each group’s typical capacity, 205 ft and 150 gpm against 2,500 ft and 400 gpm, it is about 6.5 times, and part of that comes from the larger capacity, not depth. At irrigation grade and the same capacity it is 3.8 times at 2,000 ft, the table’s deepest row; a 2,500 ft well would cost more. Bids vary about ±35%. The costs are planning-level estimates to build and equip one well (drilling, materials, pump and control equipment, valves, testing, security fencing and a small access road), from the Texas Water Development Board’s Uniform Costing Model (memo Table 14, p. 30, and Table 16, p. 32; January 2023 dollars) as used in the 2026 Region F and Region K water plans, and, for small wells, NRCS payment rates and the Region K plan’s private-well figure; raised to July 2026 with the ENR Construction Cost Index.36, 37, 39, 38, 40
Granite: the published cost schedules price small wells by depth and diameter, not by rock, and none gives a granite premium.40, 41 What the sources do support is risk. In the Llano Uplift’s crystalline rock about 30% of boreholes are dry,34 and USGS cost studies put a dry hole at roughly a fifth to a third of the cost of a finished well,42, 43 so dry holes add roughly 10–15% to the expected cost of one working well (a planning estimate, not a published figure). A working granite well also yields a median 6 gpm, against 20 gpm in the outcrop group.7
Published checks: for the crystalline rock, medians of 120 feet deep, 11 gpm and 23 feet to water, with about 30% dry boreholes.34 The petitioners’ response to Comment 8 gives, inside the proposed AVA only, on the member, median tested yields of 30 gpm (all uses) and 200 gpm (irrigation).11 That is a different sample from the seven-county medians in the table (20 gpm, and 150 gpm for irrigation wells); neither number substitutes for the other.
06
What is not known
Does a granite well ever draw Hickory Aquifer water through fractures? The sources reviewed do not establish Hickory Aquifer water supplying these granite wells, and the drawing does not show it. Driller’s reports record where water was reported, and reported water encounters do not necessarily identify which zones supply the finished well; they do not establish the water’s age, rainfall dependence, or connection to the Hickory Aquifer.7 Mason describes flow the other way near the outcrop: water “moves through cracks in the Precambrian rocks into the Hickory.”9 TWDB’s conceptual model assumes no exchange with the Precambrian “due to the low permeability of the unweathered portions.”5 Deeper fractures may allow a “potential hydrologic connection to a deeper regional flow regime,” without naming the Hickory Aquifer.34
Drought. This comparison does not show how any well responds to drought. That granite wells are sensitive to drought rests on a conference abstract and a general USGS model: a stated risk, not a measured rate.34, 33 Nor are sandstone wells shown as drought-proof: in outcrop wells far from pumping, water levels “are high in the spring when the precipitation is greatest and low in the summer,” and “Fluctuations of considerable magnitude are caused by pumping and are especially conspicuous in the artesian part of the aquifer.”9
The figures. Outcrop drawdown is an assumed range, 20 to 60 feet; downdip drawdown is the median of 25 recorded tests, some estimated or jetted. Driller’s report positions have unknown error; the 1:500,000 geology is misregistered in this area and used shifted to fit, so a well’s class is reliable regionally, not for one property; yields mix test types; water levels mix eras; TWDB’s model is regional only.8, 7, 4 The costs are planning-level estimates; bids vary about ±35%.
The drawings show three typical wells, not any particular property.
Not known, or not measured
How these numbers were made
Every figure in this section is counted by the site’s build from the sources below (src/site/make_wells.py); the drawings are drawn from the same figures.
Data: TWDB Submitted Driller’s Reports and Groundwater Database, bulk downloads of , read from the site’s privacy-scrubbed well records (38,867 records).7
Counties:Gillespie, Kimble, Llano, Mason, McCulloch, Menard and San Saba, by the 2023 Census county boundaries.
Groups (by mapped geology and inferred aquifer): the mapped rock at the well, on USGS’s regional geologic map as the site shifts it, and, downdip, the depth to the member in TWDB’s model.4, 8 This does not establish each well’s producing formation; completion records were not used to confirm each assignment. As a check, where drillers logged the water-bearing stratum, 179 of 236 logs in the outcrop group (76%) name sandstone and 37 (16%) granite, and 326 of 377 in the granite group (86%) name granite; the deep group has only 4 such logs. Outcrop: the Hickory Sandstone Member at the surface. Granite: Town Mountain Granite or a younger granite at the surface. Downdip: younger rock at the surface, and the well either coded Hickory Aquifer by TWDB or drilled to or below the top of the member in TWDB’s groundwater model. The deep downdip well: downdip wells where the model puts that top 1,500 to 3,000 feet down.
Depth: the completed depth; a depth recorded as zero is taken as not known. Yield: the largest test on each report, with 0-gpm tests kept. Water level: TWDB’s latest measurement, or the driller’s level at completion. Drawdown: of the tests on each record that give both a yield and a drawdown, the one with the highest specific capacity.
The granite example: TWDB driller’s report 524179, read from the site’s published well records. Its lithology, casing, borehole, water-bearing interval, static level and test are drawn as reported; its fractures are schematic.31
Moving water and arrows: every arrow that shows water entering a well ends on a screen or an open hole, never on blank casing; the build checks this from the drawing itself. Conceptual pathways are drawn faint and dashed and labelled. With reduced motion the water does not move and the arrows stay.
Lift energy:1.55 kWh per acre-foot per foot of lift, with lift = static level + drawdown.35
Costs: read between the rows and columns of the Uniform Costing Model tables (memo Table 14, public supply, p. 30; Table 16, irrigation, p. 32; January 2023 dollars), raised to July 2026 (× 1.0236 to the 2026 Region F plan’s September 2023 level, then × 1.0609 by the ENR index). The irrigation table stops at 2,000 ft and is not extended.36, 37, 38
pump 15, jetted 11, estimated 4, unknown 2, other 1
Drawdown test type
estimated 1, jetted 1, pump 1
none
pump 16, estimated 3, jetted 1
pump 12, jetted 10, estimated 2, unknown 1
The deep downdip wells with a yield test: stock 12, public supply 10, other or unknown 5, irrigation 3, domestic 2, industrial 1. No owner or exact location is shown here.
Sources
Alcohol and Tobacco Tax and Trade Bureau, 2026. Proposed Establishment of the Llano Uplift and Hickory Sands District Viticultural Areas. Notice No. 243, 91 FR 52576, August 14, 2026; pp. 52579 (the boundary: “to encompass the portions of the Hickory Sandstone Member geologic formation that are at 1,500 feet or higher”; the soils, “regionally called ‘hickory’ sands”) and 52584 (“hickory sands” soils in both proposed AVAs; “Hickory Sands” standing alone). www.federalregister.gov/d/2026-16670
Hickory Sands District AVA petitioners, 2023. Hickory Sands District AVA Petition. Docket TTB-2026-0005-0012; pp. 11–12 (Boundary Evidence), 17–19 (Geology, Soils, Aquifers). www.regulations.gov/document/TTB-2026-0005-0012
U.S. Geological Survey, 2022 and 2025. 1 arc-second digital elevation model, 3D Elevation Program (NAD83, NAVD88): tiles n31w100 and n32w100 (2022), n31w099 and n32w099 (2025). www.usgs.gov/3d-elevation-program
Shi, J., Boghici, R., Kohlrenken, W., and Hutchison, W., 2016. Numerical Model Report: Minor Aquifers of the Llano Uplift Region of Texas (Marble Falls, Ellenburger-San Saba, and Hickory). Texas Water Development Board; Fig. 2.2.2, the whole of section A–A′ along model row 239, at 50× (this page draws part of it); the layers (p. ES-1) and quarter-mile cells (p. 2-22). With the model’s data, v1.01: cell tops and bottoms (GAM Properties), the row 239 line and the fault lines (source geodatabase), from TWDB’s GAM download page, which says the data were “developed for regional scale use only”. www.twdb.texas.gov/groundwater/models/gam/llano/Llano_Uplift_Numerical_Model_Report_Final.pdf; www.twdb.texas.gov/groundwater/models/download.asp?row=Llano%20Uplift%20Aquifer%20System%20GAM
Hickory Sands District AVA petitioners, 2026. Petitioners’ Response to Comment 8 (TTB-2026-0005-0018). Posted as Comment 9, TTB-2026-0005-0019, October 16, 2026; sections 4.2 and 4.3. www.regulations.gov/comment/TTB-2026-0005-0019
Abbott, L.D., and Cook, T.L., 2025. Central Texas’ Llano Uplift: the keystone for reconstructing the Mesoproterozoic through Cambrian history of southern Laurentia. GSA Today 35:44–48. doi:10.1130/GSATG121GH.1
Smith, R.K., Boyer, B., and Gibbs, T., 2003. The Midway Sill, Llano Uplift, central Texas: Town Mountain Granite? No. Geological Society of America Abstracts with Programs 35(1):70. gsa.confex.com/gsa/2003SC/webprogram/Paper48345.html
Levine, J.S., and Mosher, S., 2004. Evidence for continent-continent collision: structural analysis and detrital zircon provenance in the western Llano Uplift. Geological Society of America Abstracts with Programs 36(2):80. gsa.confex.com/gsa/2004NE/webprogram/Paper70878.html
Nielson, R.L., and Barker, C.A., 2013. Geology of the western Llano Uplift, Fredericksburg to Mason, Texas. Texas Academy of Science field trip guide. Stephen F. Austin State University, ScholarWorks, Faculty Publications 1. scholarworks.sfasu.edu/geology/1
Cornish, F.G., 1975. Tidally influenced deposits of the Hickory Sandstone, Cambrian, central Texas. MS thesis, The University of Texas at Austin. hdl.handle.net/2152/20401
Kyle, J.R., Stockli, D.F., McBride, E.F., and Elliott, B.A., 2022. Covering the Great Unconformity in southern Laurentia during Rodinia breakup: detrital zircon studies of provenance evolution during Cambrian marine transgression (Llano Uplift, Texas). GSA Bulletin 135(5–6):1163–1177. doi:10.1130/B36389.1
McBride, E.F., Abdel-Wahab, A.A., and Milliken, K.L., 2002. Petrography and diagenesis of a half-billion-year-old cratonic sandstone (Hickory), Llano region, Texas. Bureau of Economic Geology, The University of Texas at Austin, Report of Investigations 264. doi:10.23867/RI0264D
Palmer, A.R., 1954. The faunas of the Riley Formation in central Texas. Journal of Paleontology 28(6), from p. 709; reprinted as Bureau of Economic Geology Report of Investigations 24. store.beg.utexas.edu/files/RI/BEG-RI0024D.pdf
Babcock, L.E., Robison, R.A., Rees, M.N., Peng, S., and Saltzman, M.R., 2007. The GSSP of the Drumian Stage (Cambrian) in the Drum Mountains, Utah, USA. Episodes 30(2). stratigraphy.org/gssps/files/drumian.pdf
Peng, S., Babcock, L.E., Robison, R.A., Lin, H., Rees, M.N., and Saltzman, M.R., 2004. Global Standard Stratotype-section and Point (GSSP) of the Furongian Series and Paibian Stage (Cambrian). Lethaia 37:365–379. stratigraphy.org/gssps/files/paibian.pdf
Cohen, K.M., Harper, D.A.T., Gibbard, P.L., and Car, N., 2025. The ICS international chronostratigraphic chart this decade. Episodes 48:105–115; the chart, version 2026/06. stratigraphy.org/ICSchart/ChronostratChart2026-06.pdf
Barnes, V.E., and Bell, W.C., 1977. The Moore Hollow Group of central Texas. Bureau of Economic Geology, The University of Texas at Austin, Report of Investigations 88. doi:10.23867/RI0088D
Barker, R.A., Bush, P.W., and Baker, E.T., Jr., 1994. Geologic history and hydrogeologic setting of the Edwards-Trinity aquifer system, west-central Texas. U.S. Geological Survey Water-Resources Investigations Report 94-4039. pubs.usgs.gov/wri/1994/4039/report.pdf
Texas Water Development Board, n.d. Submitted Driller’s Reports (from the Texas Well Report Submission and Retrieval System), report 524179: Llano County, domestic well, drilled . Locations in the database “are not verified by State staff and may be inaccurate.” www.twdb.texas.gov/groundwater/data/drillersdb.asp
Heath, R.C., 1983. Basic Ground-Water Hydrology. U.S. Geological Survey Water-Supply Paper 2220, “Well-construction methods,” pp. 52–53. pubs.usgs.gov/wsp/2220/report.pdf
Heath, R.C., 1984. Ground-Water Regions of the United States. U.S. Geological Survey Water-Supply Paper 2242, pp. 46–47 (not local). pubs.usgs.gov/wsp/wsp2242/pdf/wsp2242.pdf
Hunt, B.B., 2008. Crystalline Basement Aquifer, Llano Uplift, Central Texas: An Overlooked Minor Aquifer of Texas. Abstract, Geological Society of America 2008 Joint Meeting, Session 805, Paper 12, p. 567. gsa.confex.com/gsa/2008AM/webprogram/Paper146996.html
Natural Resources Conservation Service. Payment schedules, practice scenarios: 642, Water Well, Texas (estimated cost by diameter and depth; no rock type), retrieved October 2026. www.nrcs.usda.gov/getting-assistance/payment-schedules
Cederstrom, D.J., 1973. Cost analysis of ground-water supplies in the North Atlantic Region, 1970. U.S. Geological Survey Water-Supply Paper 2034, pp. 9, 27, 40–42. pubs.usgs.gov/wsp/2034/report.pdf
Daniel, C.C., III, 1990. Evaluation of site-selection criteria, well design, monitoring techniques, and cost analysis for a ground-water supply in Piedmont crystalline rocks, North Carolina. U.S. Geological Survey Water-Supply Paper 2341-B, pp. B30–B32. pubs.usgs.gov/wsp/2341b/report.pdf